During 2015 I collaborated in the editing of the 2nd edition of “The food and beverage sector in Italy“, a survey that analyzes the performance of the Italian Food&Beverage sector in 2015 and that deepens some news published on major newspapers and magazines in 2015 -2016.
METHODOLOGY
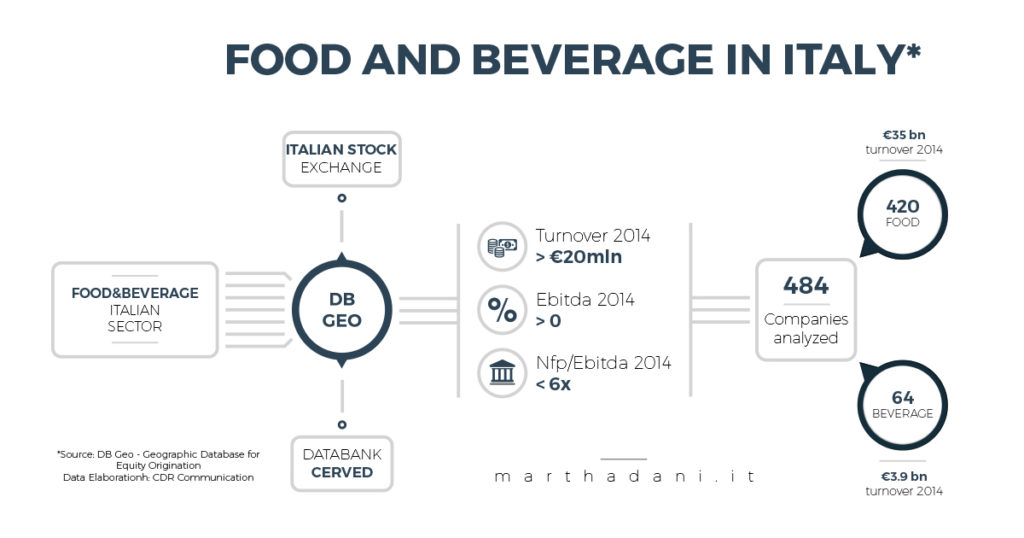
Report analyzes 484 non-listed Italian companies operating in the Food&Beverage sector selected by DB Geo database – Geographic Database for Equity Origination, realized by the Italian Stock Exchange in collaboration with Databank-Cerved Group.
The companies analyzed met the following requirements:
- Turnover in 2014 exceeding 20 million euro;
- EBITDA positive in 2014;
- Net Debt / EBITDA 2014 of less than 6x.
Among 484 players analyzed in the report, 420 belong specifically to the Food sector and the remaining 64 players belong to the Beverage sector.
FOOD AND BEVERAGE IN ITALY
The 2015 represents for the Italian economy the beginning of recovery thanks to the Italian household consumption and exports.
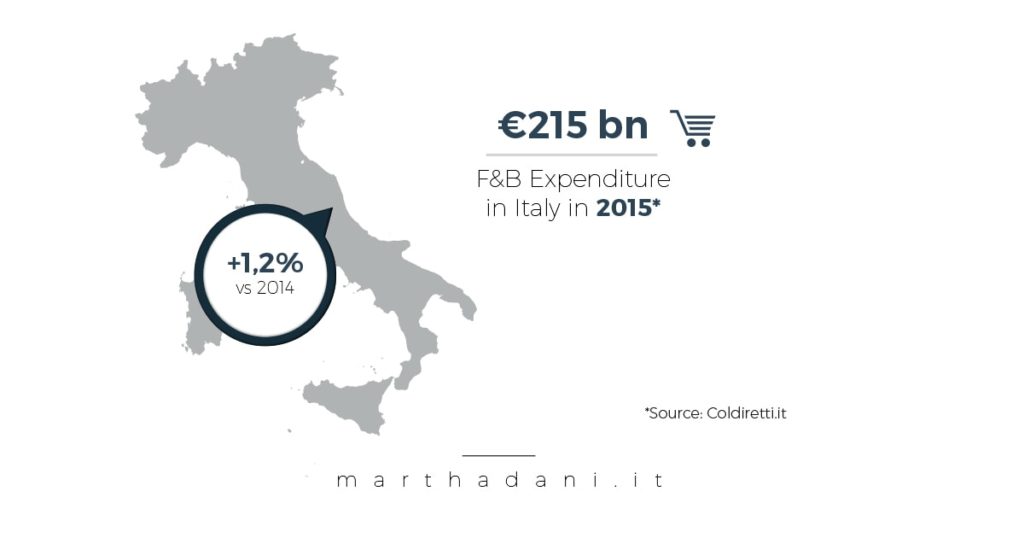
According to Istat, the “food expenditure” in Italy represent the main item of total expenditure after housing expenditure, with a total amount in 2015 equal to 215 billion euro (+ 1.2% compared to 2014).
The Food and Beverage sector has always played a key role in the Italian economy and for its development are increasingly implementing policies aimed at promoting abroad the true ‘Made in Italy‘ of the food. These actions are aimed at tackling the so-called “Italian Sounding”, ie the use of geographical names, trademarks and images that evoke Italy to promote and market products not related to Italy. A phenomenon which worldwide is estimated to have a turnover of around 60 billion Euros per year (147 million euro per day), almost double the value of Italian exports of agri-food products, such as the complaint Coldiretti (source – LaRepubblica).
ITALIAN FOOD&BEVERAGE EXPORTS
According to an analysis by Coldiretti based on Istat data, in the last 10 years, the export of food products ‘Made in Italy’ registered a record increase of 79%, reaching a record high of €36,8 billion in 2015 (source – Coldiretti).
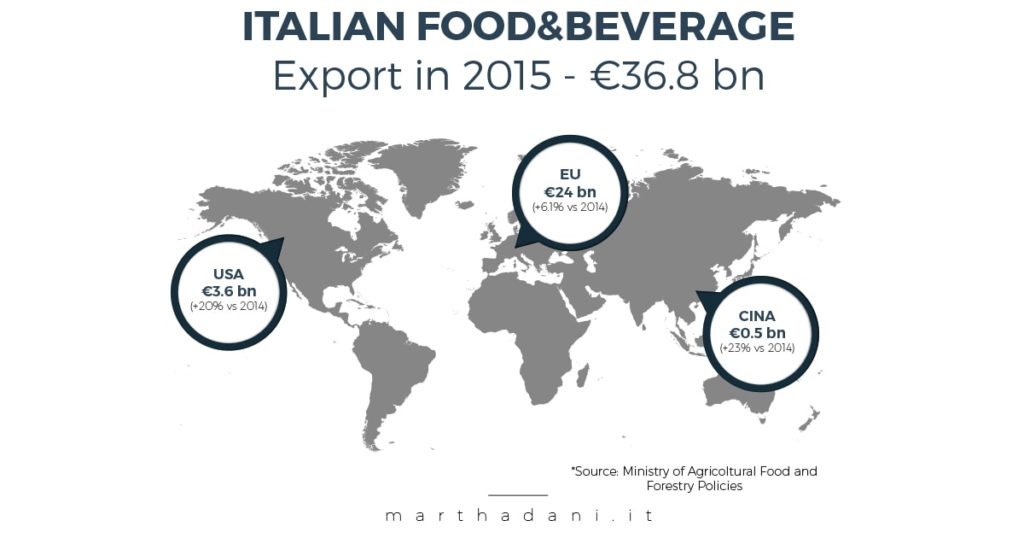
The European Union remains the main target area with over €24 billion (+ 6.1% compared to 2014), among whom the Germany with its €6.5 billion of products imported in 2015. Extra EU marks a growth of 9.4% to over €12 billion, of which emerge the United States with €3.6 billion (+ 20% compared to 2014) and China of nearly half a billion total and marks a + 23% compared to last year (source – Mipaaf).
LISTED COMPANIES IN ITALIAN STOCK EXCHANGE MARKET
At October 31, 2016 are listed on the Italian Stock Exchange Market 12 Italian companies in the food and beverage industry with a total capitalization of approximately €10.9 billion (2.3% of the total capitalization – Source Italian Stock Exchange).
MTA Market (6):
STAR Market (3):
AIM Market (3):
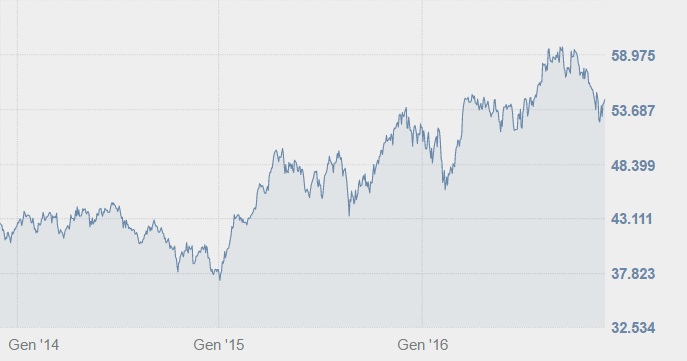
Looking to the FTSE Italia Alimentare index, which includes Bioera, Reclamation Ferraresi, Campari, Centrale del Latte di Torino, Enervit, La Doria Massimo Zanetti Beverage, Parmalat, Valsoia, you notice that the index in the last three years grew more than 31%.
For further information about the performance of each F&B sector in Italy you can download the presentation ‘The F&B sector in Italy 2016’ on the CDR Communication website or contact info@cdr-communication.it for receive the full report.
Source:
Coldiretti – www.coldiretti.it
LaRepubblica – www.repubblica.it
Ministero delle Politiche agricole alimentari e forestali (Mipaaf) – www.politicheagricole.it
Borsa Italiana – www.borsaitaliana.it
For the infographics source:
Icons –> SimpleIcon from www.flaticon.com is licensed by Creative Commons BY 3.0
Italian Map –> Italy – Single Color by FreeVectorMaps.com
World Map –> World – Single Color by FreeVectorMaps.com
Mockup Report –> Psd Magazine Mockup Template US A4 by Pixeden